Updated May 16, 2026
Status page
Public health endpoint and live status dashboard at /status. Wireable for external monitors.
A public, unauthenticated page at /status that mirrors the platform's deep healthcheck. Linkable from monitoring tools and from enterprise security questionnaires.
What's reported
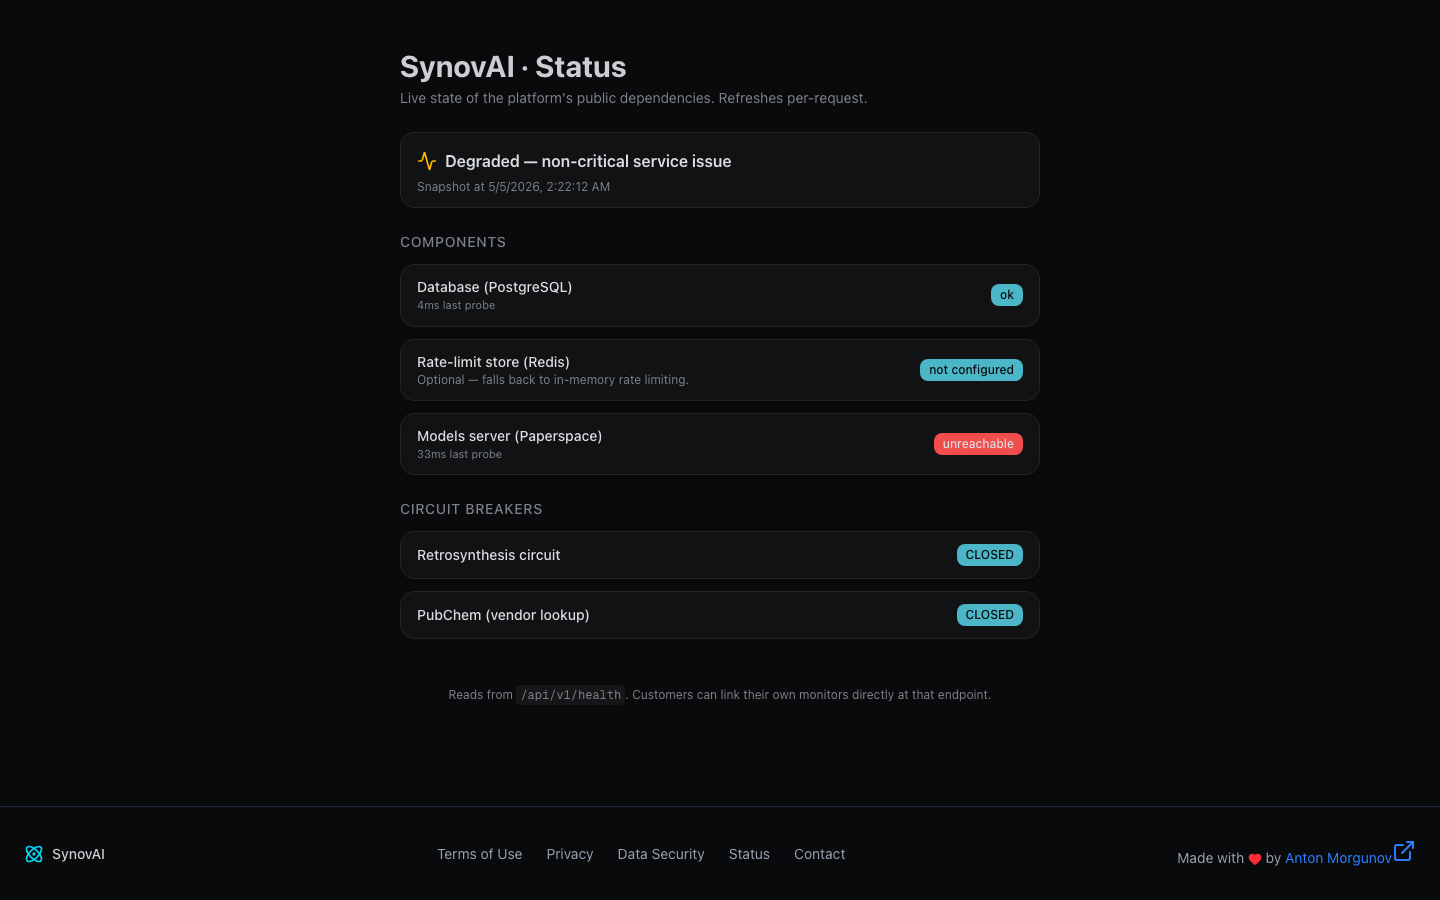
The page reads the live /api/v1/health endpoint and renders:
- Overall summary:
All systems operational,Degraded: non-critical service issue, orDown: core service unavailable. - Component probes: database, rate-limit store, models server. Each shows its current state and last-probe latency.
- Circuit breakers: open / closed / half-open state for the retrosynthesis circuit (Paperspace) and the PubChem vendor-lookup circuit. An open breaker means the upstream is unhealthy and the platform is degrading gracefully rather than 503-ing.
The page refreshes per-request, so a hard reload always reflects current state. No client-side caching.
Wiring monitors
The same /api/v1/health endpoint that powers the page is suitable
for external uptime monitors:
- Keyword
"summary":"ok": fully healthy. - Keyword
"summary":"degraded": degraded but functional. - HTTP 503: fully down (core dependency unavailable).
We use this internally with UptimeRobot and recommend the same setup for enterprise customers wiring their own monitoring.